The EBA report on financial situation in banking
On 24 November 2015 the European Banking Authority (EBA) published the report on the outcome of its 2015 EU-wide transparency exercise (hereinafter “exercise”) which is the EBA's fifth annual release. It provides both aggregate data on banking sector and the detailed individual data on capital positions, risk exposure amounts and asset quality on 105 banks from 21 countries of the European Economic Area (EEA) covering around 70% of total EU banking assets for the reference dates of 31 December 2014 and 30 June 2015. (Annex A of the report presents the names of the banks in the sample.) The data is published at the highest level of consolidation. Therefore, the Czech Republic is not directly mentioned in the report.
The exercise has been conducted for the first time relying as much as possible on supervisory reporting information: COREP and FINREP, including non-performing exposures and forbearance. On the contrary to the stress tests which use different scenarios this exercise does not go beyond the actual data.
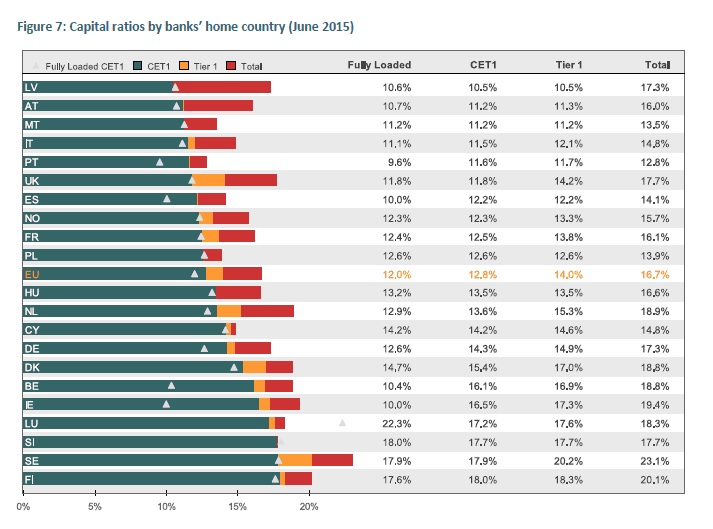
The aggregate data show strengthening of banks’ capital position. In June 2015 the aggregate CET1 capital ratio for the 105 banks in the sample was 12.8%, with the T1 capital ratio at 14.0% and the total capital ratio reaching 16.7%. The fully loaded CET1 ratio, i.e. computed without the application of the transitional adjustments set out in Part Ten of the CRR, reached 12.0%. The report presents (on page 16) the following aggregate graph for the individual countries (regarding countries directly represented in the sample):

The other monitored indicators at the aggregate level (as of June 2015) are the following:

The EBA emphasizes that the quality of assets and the levels of profitability have also improved and that non-performing exposures are close to 6% of total loans and advances across the EU, albeit with substantial variations across countries and banks (the range from 1% in Sweden to 46% in Cyprus). Profitability has improved through 2015 but remains weak by historical standards and relative to banks' estimated cost of equity. The data shows that a home bias when investing in sovereign debt is still relevant although gradually receding, as banks reported in June 2015 an increase in their holdings of non-domestic sovereign debt.
The individual bank data in user friendly formats are available here.
© 2024